
Visual Analytics Services
Visualization can provide new insights into complex data sets. Visualization helps us understand information much more easily than trying to extract meaning from raw numerical data. An explanation of Visualization can be found our definition of visualization page. In short, Visualization is a mechanism for understanding the data, a tool for decision making, and a means of communicating results.
At Videre Analytics we concentrate on the use of techniques to turn raw data into a visual form that allows for identification of similarities, anomalies or to draw attention to important features. Although useful with data sets of any size, the use of a visual analytics can be especially useful when the data sets are large and unwieldy. Data sets are becoming larger, and the contents of the data sets are more varied than ever before. Videre Analytics can work with you from data input, through transformation and exploration, to final presentation of the insight. Whether you need a graph, an info-graphic poster, an animation, a 3D printed model, or an immersive environment, we can help.
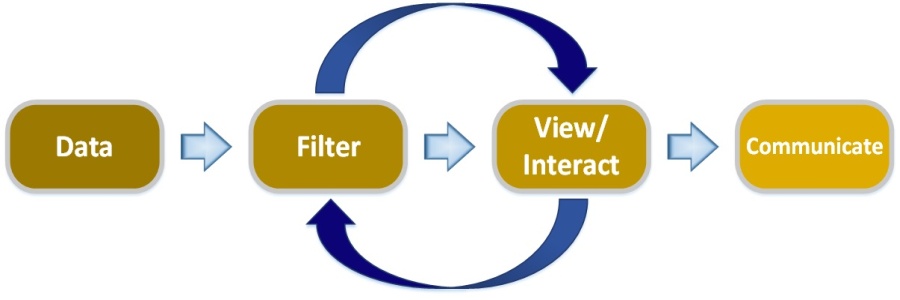
Videre Analytics can work with you through the entire process of visualization, or focus on specific steps as needed:
- obtain the data
- understand the structure of the data, multiple data sources need to be reconciled so all data are in a consistent format
- clean the data: missing or incorrect values need to be dealt with
- apply filters to the data: computation of some sort to transform the data
- view and interact with the result to extract meaning
- back to filtering as necessary
- communicate insight
We Are Experts in the Entire Visualization Ecosystem:
- software to achieve desired goals
- selection of visualization hardware
- display and output devices
- remote access to systems with 3D rendering
The Tools of Visualization
Interactive visualization with large data sets requires both powerful computing and display systems. The ability to work interactively is important because long processing and display refresh times interrupt effective work flow. Thorough data exploration requires visualization work to be done interactively for optimal results to be achieved. Videre Analytics will assist in implementing a system to handle your data visualization needs.
Considerations for such a system will include:
- space for the data
- a computer that can process the data interactively, software to do the processing and creation of views
- powerful graphics processor to render geometry to the display
- ways to view and interact with the data
We can help you build a complete system capable of visualizing your data:
- assessment of your visualization needs
- design of a hardware and software system
- definition of data movement
In addition to configuring hardware visualization systems, Videre Analytics has expertise in computer graphics techniques and visualization software.
Visualization Software
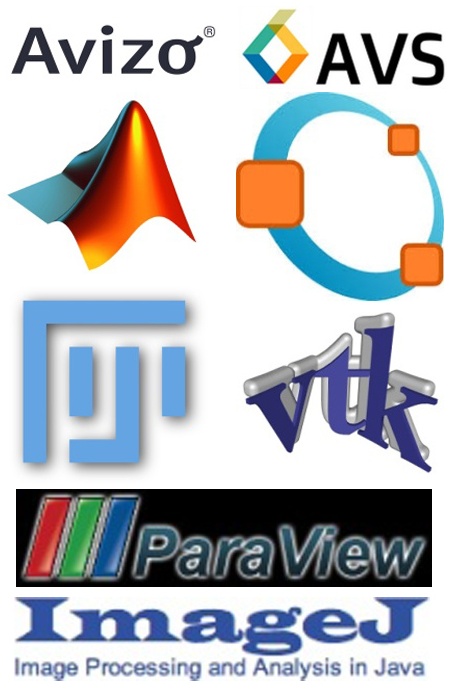 The software for visualization must be able to filter the data and generate the graphics primitives required for the visualization. Videre Analytics has expertise in the general principles of the visualization pipeline, as well as being expert users of a variety of visualization packages, including
We are also able to write programs in C/C++ and Fortran, and use scripting languages such as Python, TCL/Tk or Bash to pre- and post-process data as needed.
Visualization Hardware
A visualization system is comprised of
- powerful computing resources, storage, single system image computer
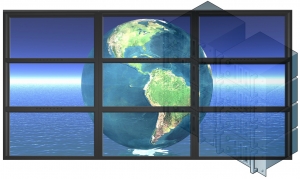
Visualization Wall
- visualization cluster
- graphics processing units,
- one or more displays, and possibly,
- a tracking system
The system needs to be powerful enough to perform computations and rendering quickly so that interaction can happen in real time. A sluggish system leads to user frustration. It is important to design a system that is responsive.
Visualization Outputs
Visualization also helps with communication of new understanding through generation of a variety of outputs. We are experienced with a variety of visualization output technologies including:
- images
- illustrations, posters, info-graphics
- animations
- interactive 3D objects for a computer display
- display wall systems
- stereo views
- anaglyph
- active/passive stereo glasses
- auto-stereo displays
- immersive environments
- IQStation
- 3D printing objects through rapid prototyping technology
- laser crystal etching (for point clouds)
Any of these outputs can be shared with colleagues or the general public when words are inadequate to explain the concepts.