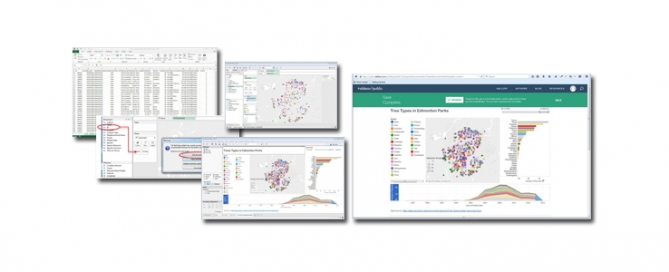
Tableau Presentation at UofA Research Data Management Week

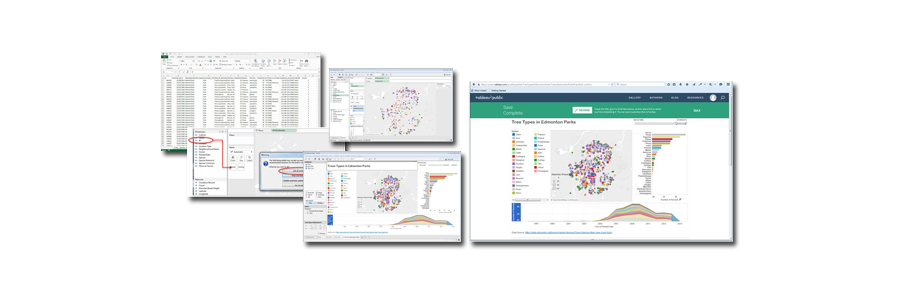
We had the great privilege to give a presentation at the recent Research Data Management Week (May 4 to May 8, 2015) hosted by the University of Alberta Library. We had a small but enthusiastic audience for the lunch time presentation: Tableau for Data Exploration and Visualization on May 7th, 2015. The talk gave an [...]

By |2017-01-12T19:45:19-07:00June 2nd, 2015|Data Analysis, Tableau, Training, Workshops|0 Comments

Follow-up on Workshop: Image Analysis with Matlab

We recently presented a workshop entitled Image Analysis with Matlab at the University of Alberta. We once again had more people registered than seats available in the lab. Sixty five workstations were used, and we currently have a waiting list long enough to warrant another such session in the near future. This followup session is scheduled for May [...]

Follow-up on the Scientific Visualization Workshop

It has been a while since our workshop in Scientific Visualization with Paraview, but it's never too late for a quick wrap-up. We were pleasantly surprised by the attendance numbers because the workshop was only advertised for about a week. There were 55 registrations through our web page, with a dozen email requests to be [...]

By |2017-01-12T19:45:19-07:00March 13th, 2015|Paraview, Training, Visualization|0 Comments

Row And Column Major Ordering

The arrangement of data in computer memory is a continuing source of discussion and confusion because the language is also used in the context of arranging data in data files. We will discuss, and hopefully clarify, the usage of the language of row- and column-major ordering. When a vector, or a 1-dimensional matrix, [...]

Scientific Visualization with Paraview

Videre Analytics is holding a workshop at the University of Alberta on Scientific Visualization with Paraview on Monday, December 8, 2014. The workshop presents principles and methods for visualizing data resulting from scientific measurements and computations. We discuss basic principles of scientific visualization and aspects of successful visualizations. The discussion will focus on Paraview, but the [...]

By |2017-01-12T19:45:21-07:00December 4th, 2014|Paraview, Training, Visualization|0 Comments

The Visualization Process – It Starts with the Data

A central goal of scientific visualization is to produce a visual entity that maintains the integrity of the underlying data. Whether the final visual is a rendered image for a poster, an animation for a presentation, a model for 3D Printing, images for a web site, figures to be included in a paper, or a [...]

By |2017-01-12T19:45:21-07:00August 19th, 2014|Visualization|0 Comments
Go to Top